AGRICULTURAL NEWS - The national crime statistics made available by the South African Police Service on 11 September 2018, has reference. The livestock theft statistics were analysed by the National Stock Theft Prevention Forum (NSTPF) and the following information are of importance.
Nationally livestock theft cases have increased by 7.8 %, but it is important to understand the extent of livestock theft in South Africa in 2018.
The extent of livestock theft is discussed under the following headlines :-
- Number of cases reported;
- Number of cases reported per province;
- Number of livestock stolen; and
- Numbers stolen per species in the different provinces.
Number of cases reported
In figure 1 below, all the livestock theft cases as per the definition in the Stock Theft Act 57 of 1959 have been included. Determining the extent of livestock theft purely on the basis of the number of cases reported is problematic, as there are other variables that also need to be taken into account. In certain regions more poultry, donkeys and horses are stolen etc.
The trend line in figure 1 is interesting, as a clear pattern since 1995 can be traced. There is a consistent rise for 6 to 7 years, followed by a decrease for 5 years, after which the cycle is repeated. 2015/16 marked the turning point, considering the increase in the number of animals stolen as reflected in figure 3. If this conclusion is true, there will be a rise in the number of cases reported over the next few years.
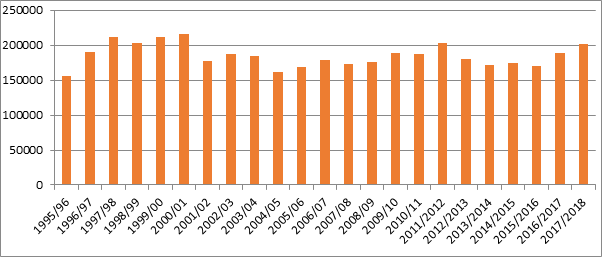 Figure 1: Number of reported livestock theft cases
According to the South African Police (SAPS, 2018:109) the following crimes are categorised as property prime :- burglary at residential premises; burglary at non-residential premises; theft of motor vehicle and motor cycle; theft out of or from motor vehicle and stock theft. Considering that all property related crimes in South Africa for the same period property crimes decreased by -6.05% but livestock theft increased by 7.2%, it must be obvious that the impact on the rural community and farming community is alarming. When the extent is considered over two years as is done after figure 2 it is startling.
Number of Cases reported per province
The number of cases per province is an indication as to the extent of livestock theft within the different provinces. The increases per province is also different as is indicated in figure 2. In figure 2 the extent of the increase is compared and the increase is indicated as from 2015/2016 to 2017/2018. The reason is to indicate that if only the increase in one year is analysed the probability to misunderstand the extent is possible.
 Figure 2: Comparison of livestock cases per province 2016/2017 and 2017/2018
The percentages indicated per province is a two-year increase. The national increase for the period in question is 14.33%, figures in figure 2 is astounding and it is obvious with 5 (five) provinces scored more than the national average. The extent of the increase in 4 provinces namely Mpumalanga, Gauteng, North West and Limpopo is of such magnitude that the crime must be declared a disaster rather than just a priority crime.
Considering that all property related crime in South Africa for the same period decreased by -6.45% and livestock theft increased by 14.33 % alarm bells must start ringing in the rural communities and the plea to declare a disaster in certain provinces is not a hollow war cry.
Number of livestock theft cases, 2017/2018
Figure 2b shows the number of livestock stolen by year. These figures, unlike those in figure 1, relate only to cattle, sheep and goats; the other animals, as per the legal definition, are excluded.
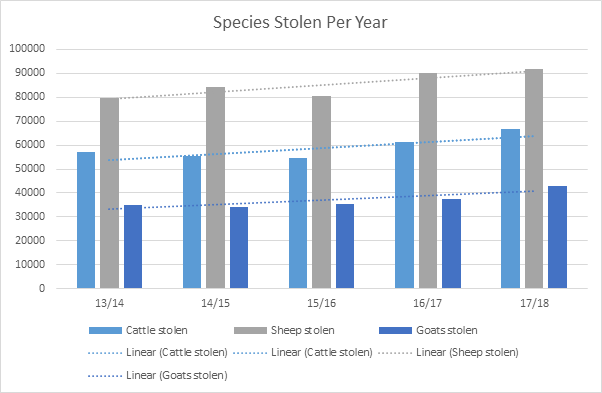 Figure 2b: Livestock stolen over the period 2013 to 2018
It is apparent from figure 2b that there has been a gradual rise in the number of livestock units stolen, irrespective of the type of animal, since 2013/14, reaching the unacceptably high figures. If we calculate the number of livestock units stolen in the country per day, the true horror of the situation becomes evident.
The figures are as follows:
- Cattle: 182 stolen per day (365 days of the year)
- Sheep: 251 stolen per day (365 days per year)
- Goats: 117 stolen per day (365 days per year)
South Africa therefore looses one economic farming unit per day. In cases where people farm with limited numbers of livestock, their livelihood is simply destroyed.
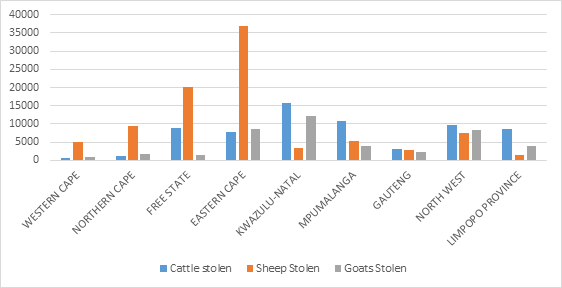 Figure 3: Number of livestock units stolen by province, 2017/18
Figure 3 shows the number of livestock units stolen by province. Outlier provinces for cattle are KwaZulu-Natal and Mpumalanga, where more than 10 000 heads were stolen. Outlier provinces for sheep are Eastern Cape and the Free State, where more than 20 000 per year were stolen. Outlier provinces for goats are Northern Cape and North West, where more than 8 000 per year were stolen. In conclusion, no single province dominates in terms of all the different types of livestock, and this is attributed to the number of people and types of animal in a specific province.
The figures in figure 3, although informative, are misleading. The Western Cape appears not to be susceptible to livestock theft, whereas overall it was the province with the highest increase in livestock theft (60%) in 2017/18. See figure 4.
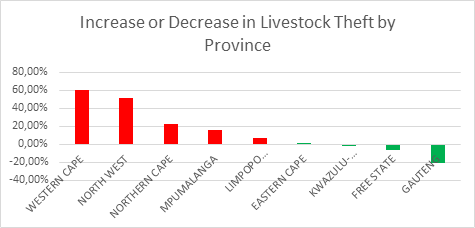 Figure 4: Increase or decrease in livestock theft by province
From figure 4 it is evident that the provinces with the highest increase in the number of animals stolen, are the Western Cape and North West. Clarity is necessary, however, as this is once again misleading. The Western Cape is the only province in the country with an unprecedented increase in the number in all animals cattle 196%, sheep 49,8% and goats 67%. In North West there was an unprecedented rise in the number of goats stolen, and this contributed to an increase of 1296%.
In North West the increase relates only to goats. Mpumalanga experienced a 30.2% increase in the number of cattle stolen. The main contributor in the Northern Cape was a 27% increase in the number of sheep stolen. The provinces with notable decreases were the Free State and Gauteng.
Conclusion
It is clear that livestock theft reached endemic proportions and the necessary action must be taken by the Criminal Justice System to assist rural communities in their fight again crime. In very few communities in South Africa any serious attempts are made to establish Stock Theft Information Forums. Communities must insist that their Stock Theft Unit in their particular area establish such STIC’S.
Provincial Stock Theft Forums must be sensitised as to the extent of the crime and possible measures that can be implemented to reduce the effect of the crime.
In areas where livestock theft has reach disastrous proportions, the necessary actions must be taken by the communities to inform the court that livestock theft is effecting them emotionally and economically.
The National Stock Theft Forum requests that all role players in the criminal justice system and red meat industry urgently play an active role in stock theft prevention and urge the general public for their assistance.
The trend line in figure 1 is interesting, as a clear pattern since 1995 can be traced. There is a consistent rise for 6 to 7 years, followed by a decrease for 5 years, after which the cycle is repeated. 2015/16 marked the turning point, considering the increase in the number of animals stolen as reflected in figure 3. If this conclusion is true, there will be a rise in the number of cases reported over the next few years.
According to the South African Police (SAPS, 2018:109) the following crimes are categorised as property prime :- burglary at residential premises; burglary at non-residential premises; theft of motor vehicle and motor cycle; theft out of or from motor vehicle and stock theft. Considering that all property related crimes in South Africa for the same period property crimes decreased by -6.05% but livestock theft increased by 7.2%, it must be obvious that the impact on the rural community and farming community is alarming. When the extent is considered over two years as is done after figure 2 it is startling.
Number of Cases reported per province
The number of cases per province is an indication as to the extent of livestock theft within the different provinces. The increases per province is also different as is indicated in figure 2. In figure 2 the extent of the increase is compared and the increase is indicated as from 2015/2016 to 2017/2018.
The reason is to indicate that if only the increase in one year is analysed the probability to misunderstand the extent is possible.
'We bring you the latest Garden Route, Hessequa, Karoo news'